EBITDA Normalization & PPO Optimization
Your Margins Are Lying.
We Find the Truth.
We bypass broken dashboards and extract your raw data to locate the exact source of overhead bloat, unsanitized PPO write-offs, and phantom EBITDA — benchmarked against a 2,500-practice national baseline.
Sample Deliverable
See what a forensic brief looks like.
An anonymized Practice Intelligence Brief from an actual PDA engagement — multi-specialty group, 15+ providers, $12.2M production. EBITDA normalization, payer mix forensics, and valuation architecture.

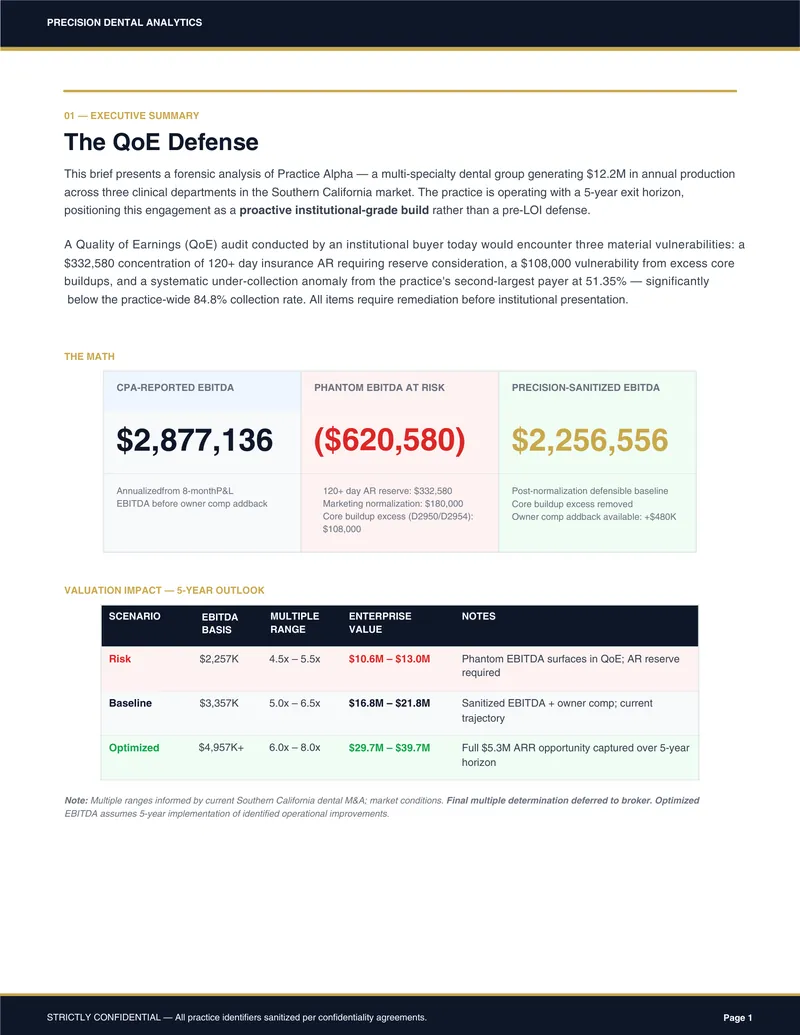
Full 12-page brief: executive summary, revenue architecture, payer mix forensics, and EBITDA normalization bridge.
The Profitability Formula
Five variables. One equation.
Every practice's financial health reduces to this formula. Small improvements in each variable compound to transformational profitability gains.
This formula demonstrates how small improvements in each variable compound to significant profitability gains. A 2% improvement across all inputs can yield 15–20% more annual profit.
Core Financial Benchmarks
Where do you stand?
Data compiled from 2,500+ dental practices across the United States, analyzed quarterly. Benchmarks represent 75th-percentile performance for top-quartile practices.
Collections Rate
TargetGeneral practice avg: 98%
Every 1% increase ≈ $1,000 more per $100K revenue
Overhead Percentage
TargetGeneral practice avg: 59%
Every 1% reduction directly increases profitability
Profit Margin
TargetGeneral practice avg: 40%
Top 10% practices consistently exceed 45%
Revenue Per Patient
TargetGeneral practice avg: $950
Higher values indicate better case acceptance
A/R Days
TargetGeneral practice avg: 28
Lower is better — efficient collection processes
Staff Labor %
TargetGeneral practice avg: 25%
Includes wages, benefits, and payroll taxes
Benchmarks updated quarterly. Specialty-adjusted benchmarks available during engagement.
Forensic Diagnostic
7 problems destroying your margins.
These aren't theoretical risks — they're the exact failure patterns we identify in practice after practice during pre-LOI due diligence. Most owners don't see them until a buyer's QofE team does.
Lack of Regular Financial Review
10–20% revenue loss through missed collections and inefficiencies
Practices that skip monthly financial reviews become complacent — leading to financial disorganization, missed collections, and even exposure to internal theft.
Not Balancing Dental Fees Annually
3–5% profitability loss annually when fees lag inflation
Keeping the same fee schedule for years erodes profitability as overhead and material costs rise. Fees should sit at the 75th–85th percentile for your market.
Using Outdated Systems and Software
15–25 hours per week in lost productivity
Legacy practice management software, manual insurance verification, and paper-based workflows create compounding inefficiencies that directly reduce provider productivity.
Lack of a Proper Operating Budget
10–15% annual overspend on non-essentials
Without a detailed monthly budget, practices overspend during growth periods and hemorrhage cash during slow months. An emergency fund is non-negotiable.
No Forward Financial Planning
20–30% higher borrowing costs and missed growth windows
Failure to plan for capital expenditures, market shifts, or seasonal slowdowns leads to reactive borrowing at unfavorable terms and missed acquisition opportunities.
Excessive Debt Accumulation
Debt-to-income above 40% limits growth and exit options
Overleveraged practices lose negotiating power in M&A situations. Buyers discount valuations heavily when debt service consumes operating cash flow.
Under-Investing in Practice or Assets
15–25% lower practice valuation at exit
Deferred investment in technology, CE, and facility upgrades signals neglect to institutional buyers. The compounding effect reduces competitive position and exit multiples.
Sound Familiar?
Run our free EBITDA Leakage Calculator to quantify what these problems are costing you.
Start EBITDA Diagnostic →Essential Calculations
The math behind the margins.
These are the formulas we deploy on every engagement. Know the inputs, know the outputs, know where you're leaking.
Practice Profitability
Shows how all key metrics compound to drive profitability.
Formula
(Visits × Production/Visit × Collection %) − Overhead
Example
(1,000 × $300 × 0.98) − $150,000 = $144,000
Overhead Percentage
For every 1% reduction in overhead, profit increases 1%.
Formula
(Total Expenses ÷ Total Collections) × 100
Example
($350,000 ÷ $500,000) × 100 = 70%
Collection Rate Impact
Small improvements in collections have massive cumulative impact.
Formula
(Collection % Increase ÷ 100) × Practice Revenue
Example
(1 ÷ 100) × $800,000 = $8,000 additional income
Hygienist Productivity
Properly utilized hygienists are profit centers, not cost centers.
Formula
Hygienist Production Goal = 3 × Hygienist Salary
Example
3 × $60,000 = $180,000 production target
Staff Labor Expense
Labor costs above 30% typically indicate overstaffing or underproduction.
Formula
(Total Staff Wages ÷ Total Production) × 100
Example
($200,000 ÷ $800,000) × 100 = 25%
Frequently Asked Questions
Financial Forensics FAQ
What are the most important financial KPIs for dental practices?
+
The most critical financial KPIs include collection percentage (target: 98%+), accounts receivable aging (goal: under 30 days), production per provider, overhead percentage (target: 55–65%), and profit margins (target: 35–40%). These metrics provide comprehensive insight into practice financial health and identify specific areas for improvement.
How do I calculate my dental practice's true profitability?
+
True profitability = (Total Collections − Total Expenses − Owner Compensation) ÷ Total Collections × 100. Include all expenses: staff wages and benefits, supplies, lab fees, rent/mortgage, equipment leases, insurance, marketing, and utilities. Most practices miss hidden costs like equipment depreciation and opportunity costs.
What is a good collection percentage for dental practices?
+
Top-performing dental practices achieve 98%+ collection rates. The industry average is 95–97%. Collection percentage is calculated as (Total Collections ÷ Total Production) × 100. Rates below 95% indicate potential issues with insurance processing, patient payment policies, or billing procedures.
How do I calculate dental practice overhead percentage?
+
Overhead % = (Total Operating Expenses ÷ Total Collections) × 100. Include all expenses except owner compensation and taxes. Target range is 55–65% for general practices. Higher percentages indicate inefficiencies in cost management or pricing strategies.
What causes low case acceptance rates in dental practices?
+
Low case acceptance (below 75%) typically results from inadequate case presentation skills, limited payment/financing options, insufficient patient education, pricing not aligned with perceived value, and failure to present treatment in terms of patient benefits rather than clinical features.
How can I identify hidden revenue leaks in my dental practice?
+
Hidden revenue leaks include uncollected insurance claims, missed recall appointments, incomplete treatment plans, inadequate fee schedules, scheduling gaps, and poor case presentation. Conduct monthly audits of A/R aging, treatment plan acceptance rates, and scheduling efficiency to uncover these leaks.
The Next Step
Buyers will forensic your data.
Beat them to it.
Most founders go to market expecting a 10x platform valuation, unaware that their clinical data is fragmented. Buyers don't pay for clinical potential — they pay for auditable reality.
Confidential intake. Typically responded to within 48 hours.
The Engagement
See exactly how a PDA forensic analysis works — phases, timeline, deliverables, and pricing.